A Simple Erlang Application, with Prometheus
November 23, 2016
A simple HTTP server built with Elli that exposes metrics for Prometheus.

The Code
The code is identical to the code in A Simple Erlang Application, with the following modifications:
- new dependency on an Erlang client for Prometheus.io, a monitoring system and time series database,
- new handler to log metrics and expose an endpoint for Prometheus, and
- new child spec to call elli_middleware and stack the prometheus.io handler before the original handler.
You can find the code for this blog entry here.
New dependency on Erlang client for Prometheus.io
    PROMETHEUS_GIT=https://github.com/deadtrickster/prometheus.erl.git
    PROMETHEUS_TAG=v3.1.0
    PROMETHEUS=${SRC}/prometheus.erl
    PROMETHEUS_APP=${PROMETHEUS}/_build/default/lib/prometheus

    ${PROMETHEUS}:
    	(cd ${SRC}; git clone ${PROMETHEUS_GIT})
    	(cd ${PROMETHEUS}; git checkout tags/${PROMETHEUS_TAG})
    ${PROMETHEUS_APP}/ebin: ${PROMETHEUS}
    	(cd ${PROMETHEUS} ; rebar3 compile)
This new section in the Makefile downloads and compiles the Erlang client for prometheus. The ${PROMETHEUS_APP}/ebin is then added as a dependency for compiling the Erlang code in this project.
New handler to log metrics and expose an endpoint for Prometheus
    %% @doc Exposes HTTP responses and timings as Prometheus metrics.
    %%
    %% Defines two metrics:
    %%
    %%        * the counter http_requests_total, with the label statuscode.
    %%
    %%        * the histogram http_response_microseconds
    %%
    %% The duration measures the time, in microseconds, between when
    %% the request line was received and the response was sent. This
    %% is as close we can get to the actual time of the request as
    %%  seen by the user.

    -module(elli_prometheus).

    -behaviour(elli_handler).

    -include_lib("elli/include/elli.hrl").

    -export([handle/2, handle_event/3]).

    % Expose /metrics for Prometheus to pull.
    handle(Req, _Args) ->
        handle(Req#req.method, elli_request:path(Req), Req).

    handle(’GET’, [<<"metrics">>], _Req) ->
        {ok, [], prometheus_text_format:format()};
    % All other requests are passed to normal handler.
    handle(_Verb, _Path, _Req) -> ignore.

    % Return path, minus any query string, as a binary.
    rawpath(#req{raw_path = Path}) ->
        case binary:split(Path, [<<"?">>]) of
          [P, _] -> P;
          [P] -> P
        end.


    handle_event(request_complete,
                 [Req, ResponseCode, _ResponseHeaders, _ResponseBody,
                  Timings],
                 _Config) ->
        prometheus_counter:inc(http_requests_total,
                               [ResponseCode, rawpath(Req)]),
        Start = proplists:get_value(request_start, Timings),
        End = proplists:get_value(request_end, Timings),
        Delta = timer:now_diff(End, Start),
        io:format("handle_event: ~p  ~p  ~p~n",
                  [ResponseCode,
                   erlang:convert_time_unit(Delta, native,
                                            micro_seconds),
                   rawpath(Req)]),
        % The "_microseconds" suffix in the metric name is magic.
        % Prometheus.erl converts the Erlang native time difference to microseconds.
        prometheus_histogram:observe(response_time_in_microseconds,
                                     [rawpath(Req)], Delta),
        ok;
    handle_event(chunk_complete,
                 [Req, ResponseCode, ResponseHeaders, _ClosingEnd, Timings],
                 Config) ->
        handle_event(request_complete,
                     [Req, ResponseCode, ResponseHeaders, <<>>, Timings],
                     Config);
    handle_event(Event, [Req, _Exc, _Stack], _Config)
        when Event =:= request_throw;
             Event =:= request_exit;
             Event =:= request_error;
             Event =:= request_parse_error;
             Event =:= bad_request;
             Event =:= client_closed;
             Event =:= client_timeout ->
        prometheus_counter:inc(http_requests_total,
                               [Event, rawpath(Req)]),
        ok;
    handle_event(elli_startup, [], _Config) ->
        prometheus_counter:new([{name, http_requests_total},
                                {help, "Total HTTP requests"},
                                {labels, [status, path]}]),
        prometheus_histogram:new([{name,
                                   response_time_in_microseconds},
                                  {labels, [path]},
                                  {buckets,
                                   [10, 100, 1000, 10000, 100000, 300000, 500000,
                                    750000, 1000000, 1500000, 2000000, 3000000]},
                                  {help,
                                   "Microseconds between request receipt "
                                   "and response send."}]),
        ok;
    handle_event(_, _, _) ->
        %% Future-proof.
        ok.
Lots of code here. Some things of note:
- This is a normal elli callback module, just like
es_callback.erlin the last blog entry. As shown in the next section, thees_supmodule stacks the handlers when configuringelli_middleware. - If a callback module returns the atom
ignore, the request is passed to the next handler in the stack. - The
elli_startupevent (the lasthandle_eventin the listing above) is where you define the metrics. - A metric label let’s you create subtotals. For example,
http_requests_totalhas subtotals by status and resource. - The
_microsecondssuffix on the metric name is “magic”; that is, it tells the client library to convert native time to microseconds. See full list of magic suffixes at lines 27 - 37 ofprometheus_time.erl - This handler exposes the
/metricsresource, which is the default endpoint that Prometheus looks for. - This handler is decoupled from all other handlers.
I figured out this code by looking at other elli middleware (for example, access logging) and then finding the elli-lib/elli_prometheus example.
New child spec to call elli_middleware
    -module(es_sup).

    -behaviour(supervisor).

    -export([start_link/0]).

    -export([init/1]).

    start_link() ->
        supervisor:start_link({local, ?MODULE}, ?MODULE, []).

    init([]) ->
        MiddlewareConfig = [{mods,
                             [{elli_prometheus, []}, {es_callback, []}]}],
        ElliOpts = [{callback, elli_middleware},
                    {callback_args, MiddlewareConfig}, {port, 3000}],
        ElliSpec = {es_http, {elli, start_link, [ElliOpts]},
                    permanent, 5000, worker, [elli]},
        {ok, {{one_for_one, 5, 10}, [ElliSpec]}}.
The difference from the last blog post is the MiddlewareConfig, which stacks the handlers and ElliOpts, which tells Elli to use the middleware (which itself is a handler).
prometheus.yml
    global:
      scrape_interval:     1s

      external_labels:
        monitor: ’elli-monitor’

    scrape_configs:
      - job_name: ’prometheus’
        static_configs:
          - targets: [’localhost:9090’]

      - job_name: ’erlsrv’
        static_configs:
          - targets: [’127.0.0.1:3000’]
This configures prometheus. Change to directory that holds this file and start prometheus.
Notes
elli: version 1.0.5 versus version 2.0.0
The elli_lib project on GitHub has released a 2.0.0 version of elli with these changes (among others):
- tracks response size as well as timings
- uses Erlang’s monotonic clock
- sprinkles lots of
specdefinitions throughout the code base - changes the semantics of request_start event
The last change was giving me request durations that were over second seconds in some cases, which is why I stayed with version 1.0.5.
Built in metrics that come with prometheus.erl
By simply including the prometheus.erl client, I automatically get a ton of metrics exposed on the /metrics endpoint, including:
- Total number of context switches since the system started
- Garbage collection: number of GCs
- Garbage collection: bytes reclaimed
- Total length of the run-queues
- The total amount of memory currently allocated.
- … and so on.
You can find the entire list in the README for https://github.com/deadtrickster/prometheus.erl in the section “Erlang VM & OTP Collectors.”
Prometheus Memory Consumption
I plan to run Prometheus on a Raspberry Pi 3, which only has 1G of RAM. Some notes on prometheus memory usage:
- stores metric data in “chunks”
- each chunk is 1024 bytes
- keeps all “currently used” chunks in memory
- limit on in-memory chunks set by
storage.local.memory-chunksconfig, default value is 1048576 bytes (1 MB) - don’t hit limit, as metric data is dropped (“throttled ingestion”)
storage.local.retentionconfig defines how long to store metric history on disk
Rule of thumb:
- prometheus RAM required = 3 x
storage.local.memory-chunksx 1024 bytes - plan for at least three active chunks for each time series you have
- monitor prometheus memory usage with two metrics exported by prometheus itself:
prometheus_local_storage_memory_chunksprocess_resident_memory_bytes
Reference: https://prometheus.io/docs/operating/storage/.
Results
Starting up the application
    $ ./run.sh
    Erlang/OTP 19 [erts-8.0.1] [source-ca40008] [64-bit] [smp:8:8] [async-threads:10] [hipe] [kernel-poll:false]

    Eshell V8.0.1  (abort with ^G)
    1> application:start(erlsrv).
    ok
    2>
and hitting it with some traffic
    #! /bin/sh -e
    # Lay siege to Elli.

    CLIENTS=5
    DURATION=60S
    siege --log=siege.log -c $CLIENTS -t $DURATION http://127.0.0.1:3000/hello/world

    CLIENTS=50
    DURATION=60S
    siege --log=siege.log -c $CLIENTS -t $DURATION http://127.0.0.1:3000/hello/world

    CLIENTS=5
    DURATION=60S
    siege --log=siege.log -c $CLIENTS -t $DURATION http://127.0.0.1:3000/hello/world
loads Prometheus with some data. Here are a examples of Prometheus graphs.
http_requests_total
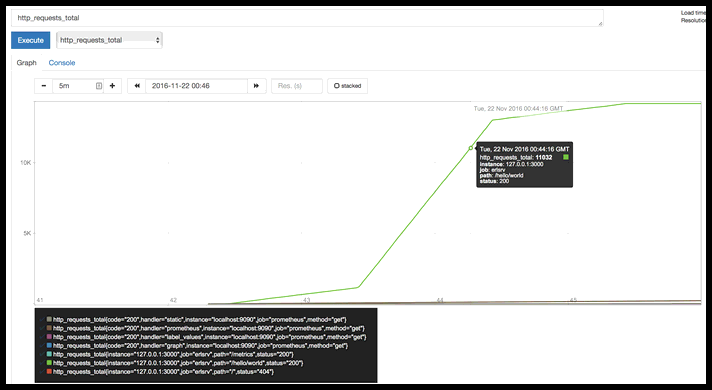
Prometheus graphs metrics by label and job. I chose the same metric name as prometheus uses internally, so there is a name collision; prometheus uses different labels than I did, so the first four rows in the legend have the labels code, handler, instance, and method (the Prometheus labels), and the last three have instance, job and path (the erlsrv labels).
rate(response_time_in_microseconds_sum[15s]) / rate(response_time_in_microseconds_count[15s])
Prometheus supports expressions; this one computes average response time over last 15 seconds.
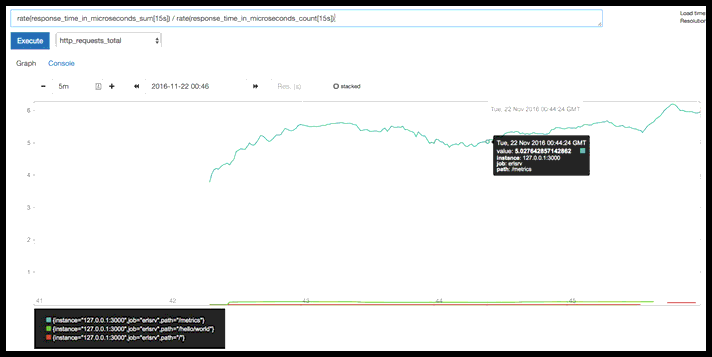
The /metrics page hovers under six microseconds, and /hello/world is well under one microsecond.
erlang_vm_memory_bytes_total
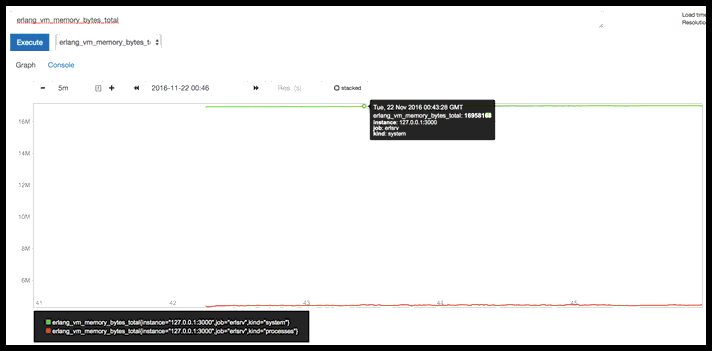
System memory up over 16M, process memory just over 4M, both stable. Not surprisingly, the “load” I put on (200 requests/second for a tiny response body with no backend work) doesn’t register.
prometheus_local_storage_memory_chunks
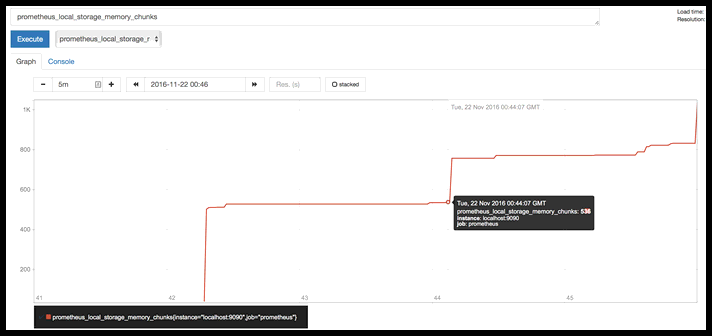
This one kept climbing to the right of this graph after I shut off erlsrv, until it plateaued at 7.5K.
Tags: erlang prometheus